1. Overview: Major UI Overhaul in ArcusOS 10.6.0
With the release of OS version 10.6.0 (ArcusOS) for the HPE Alletra Storage MP B10K (B10120) all-NVMe modular storage system, Hewlett Packard Enterprise introduced a major transformation of its on-premises web management console.
Departing from the legacy dark-grey single-level sidebar interface utilized up through version 10.5.x, OS 10.6.0 introduces a modern, cloud-native white card theme combined with an expandable multi-tier tree navigation structure.
This field guide provides an exhaustive review of the updated interface, comparing key menu workflows, hardware diagnostic screens, and central security configuration options from an enterprise engineering perspective.
2. Comparing UI Architecture: 10.5.x vs. 10.6.0
| Feature / Dimension | Legacy UI (OS 10.5.50 & Prior) | New UI (OS 10.6.0) | Field Engineering Advantage |
|---|---|---|---|
| Theme & Aesthetic | Dark-grey monochrome sidebar | Clean, card-based white layout | Greatly improved readability; unified GreenLake cloud look-and-feel |
| Left Navigation | Icon-only single-tier menu | Multi-tier collapsible text-labeled tree | Instant 1-click navigation directly to Drives, Ports, and sub-components |
| Top Branding | Minimal generic logo glyph | HPE Logo with full model identifier | Immediate visual identification across multi-array data center deployments |
| Port / Switch Access | Nested within deep hardware tabs | Dedicated Ports and Switches items | Rapid verification of SAN fabric link speed and port health |
| Integrated Settings | Dispersed configuration tabs | Consolidated Settings tree | Unified management for Ransomware Detection, Volume Retention, and Telemetry |
Side-by-Side System Dashboard Comparison
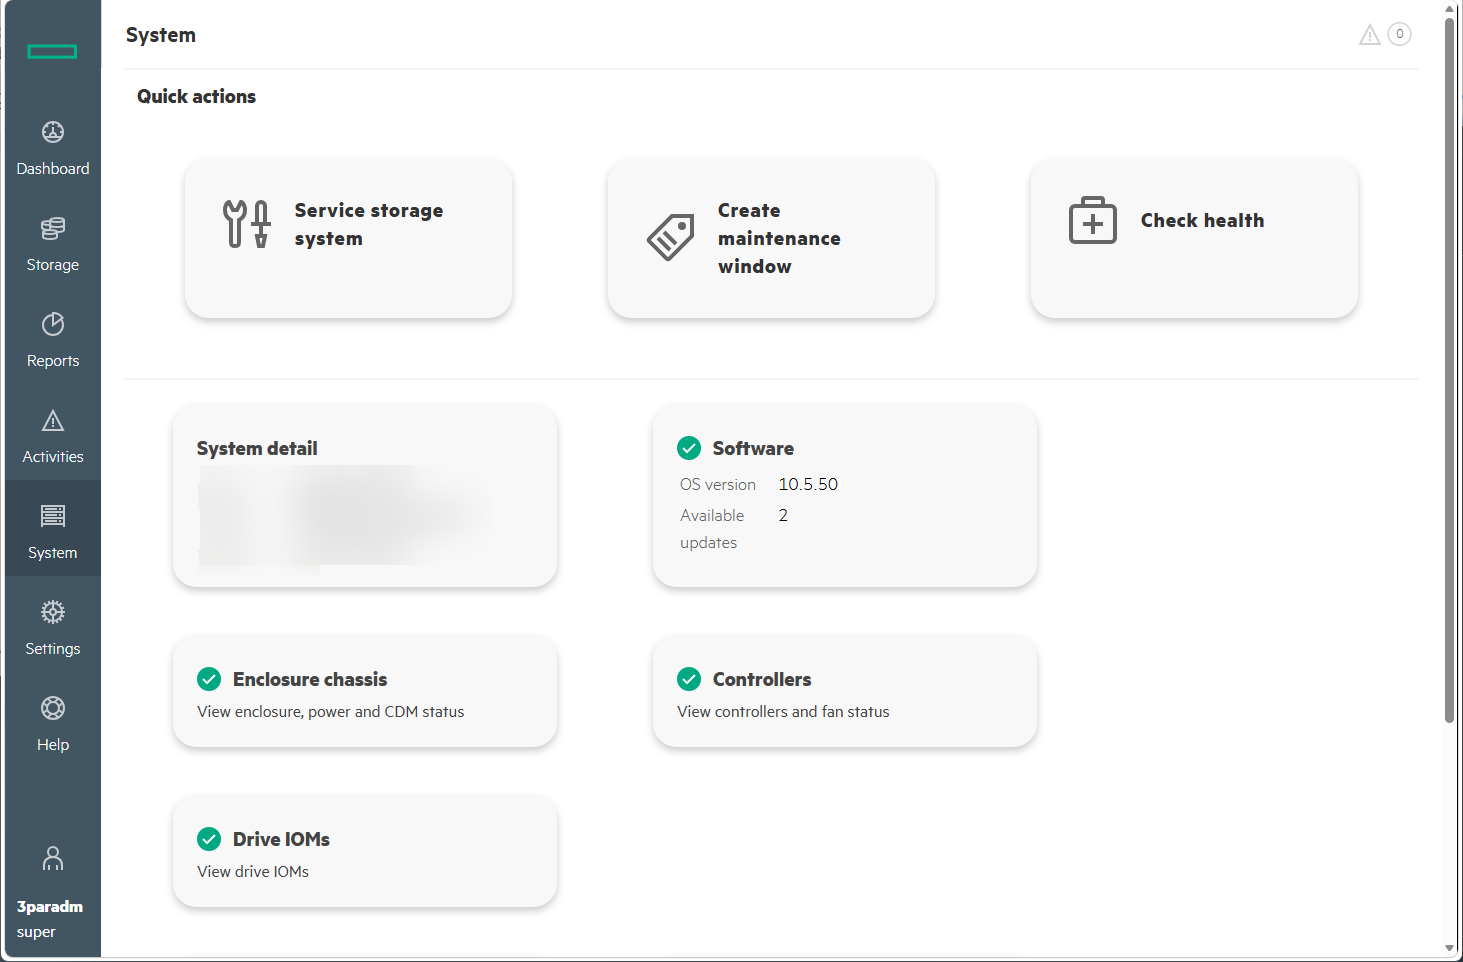
Figure 1. [Pre-Upgrade] Legacy dark sidebar System dashboard in OS 10.5.50
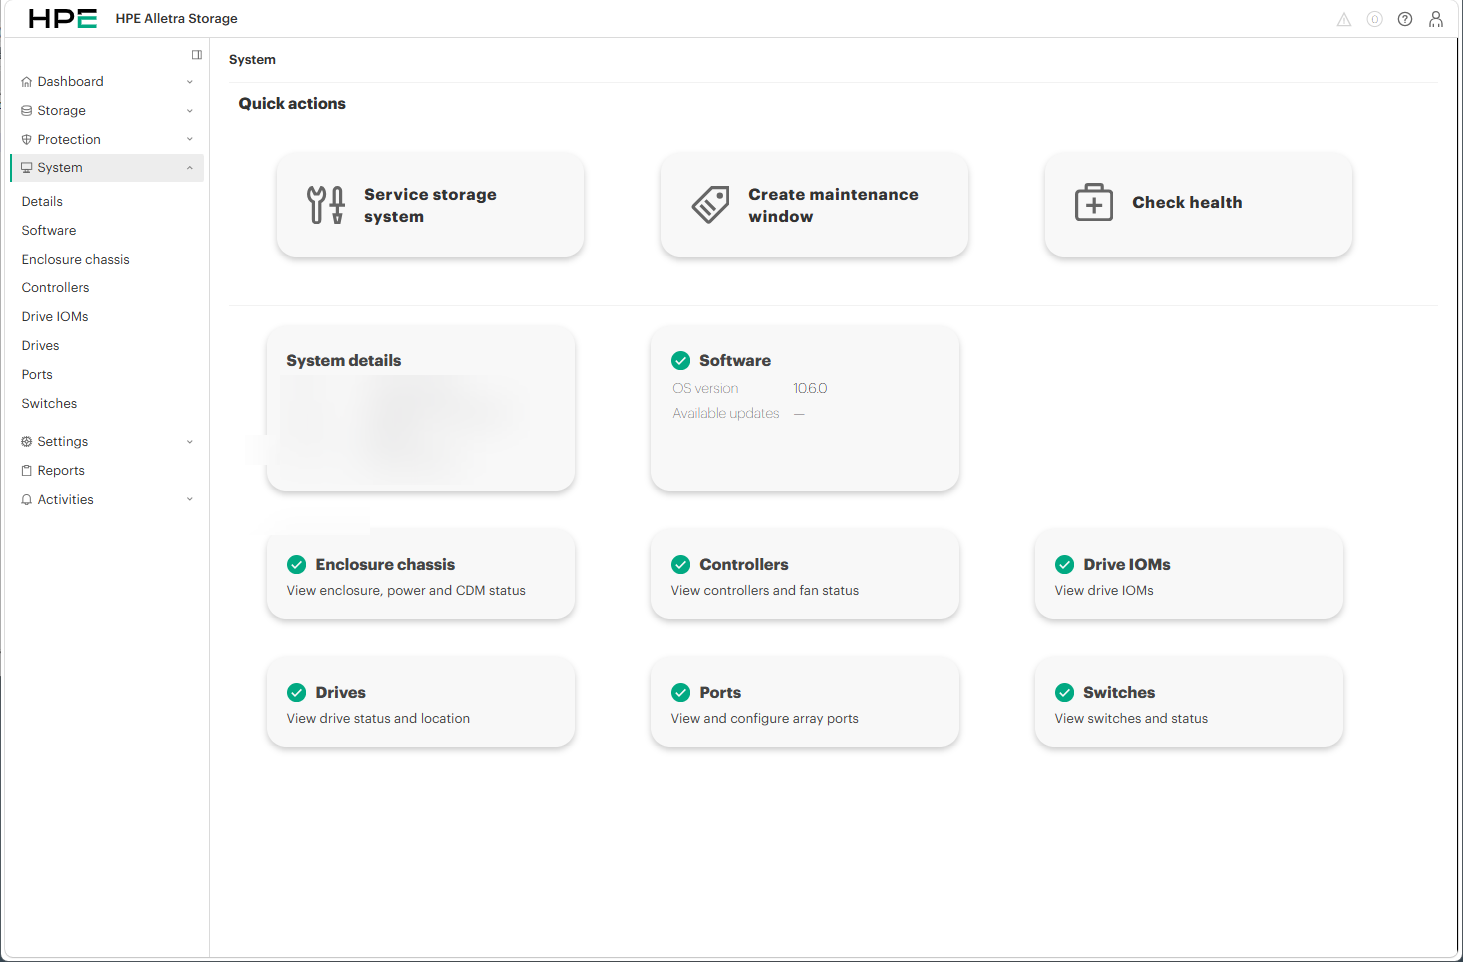
Figure 2. [Post-Upgrade] Modern white tree-navigation System dashboard in OS 10.6.0
3. Comprehensive Breakdown of the 6 Core Menus
3.1. Dashboard (System Health, Capacity & Performance)
The default landing view delivers immediate visibility into operational health, storage allocation, and real-time throughput metrics via three primary card widgets.
- Health: Displays active alerts along with real-time status glyphs for Storage, Protection, System, Call Home, and Data Services Cloud Console (DSCC).
- Usable Capacity: Visualizes total vs. available capacity via a clean donut chart, differentiating between Private/Shared usage, snapshots, system overhead, and unallocated blocks.
- Performance: Tracks online connected hosts alongside live trend graphs for IOPS, bandwidth, and I/O latency.
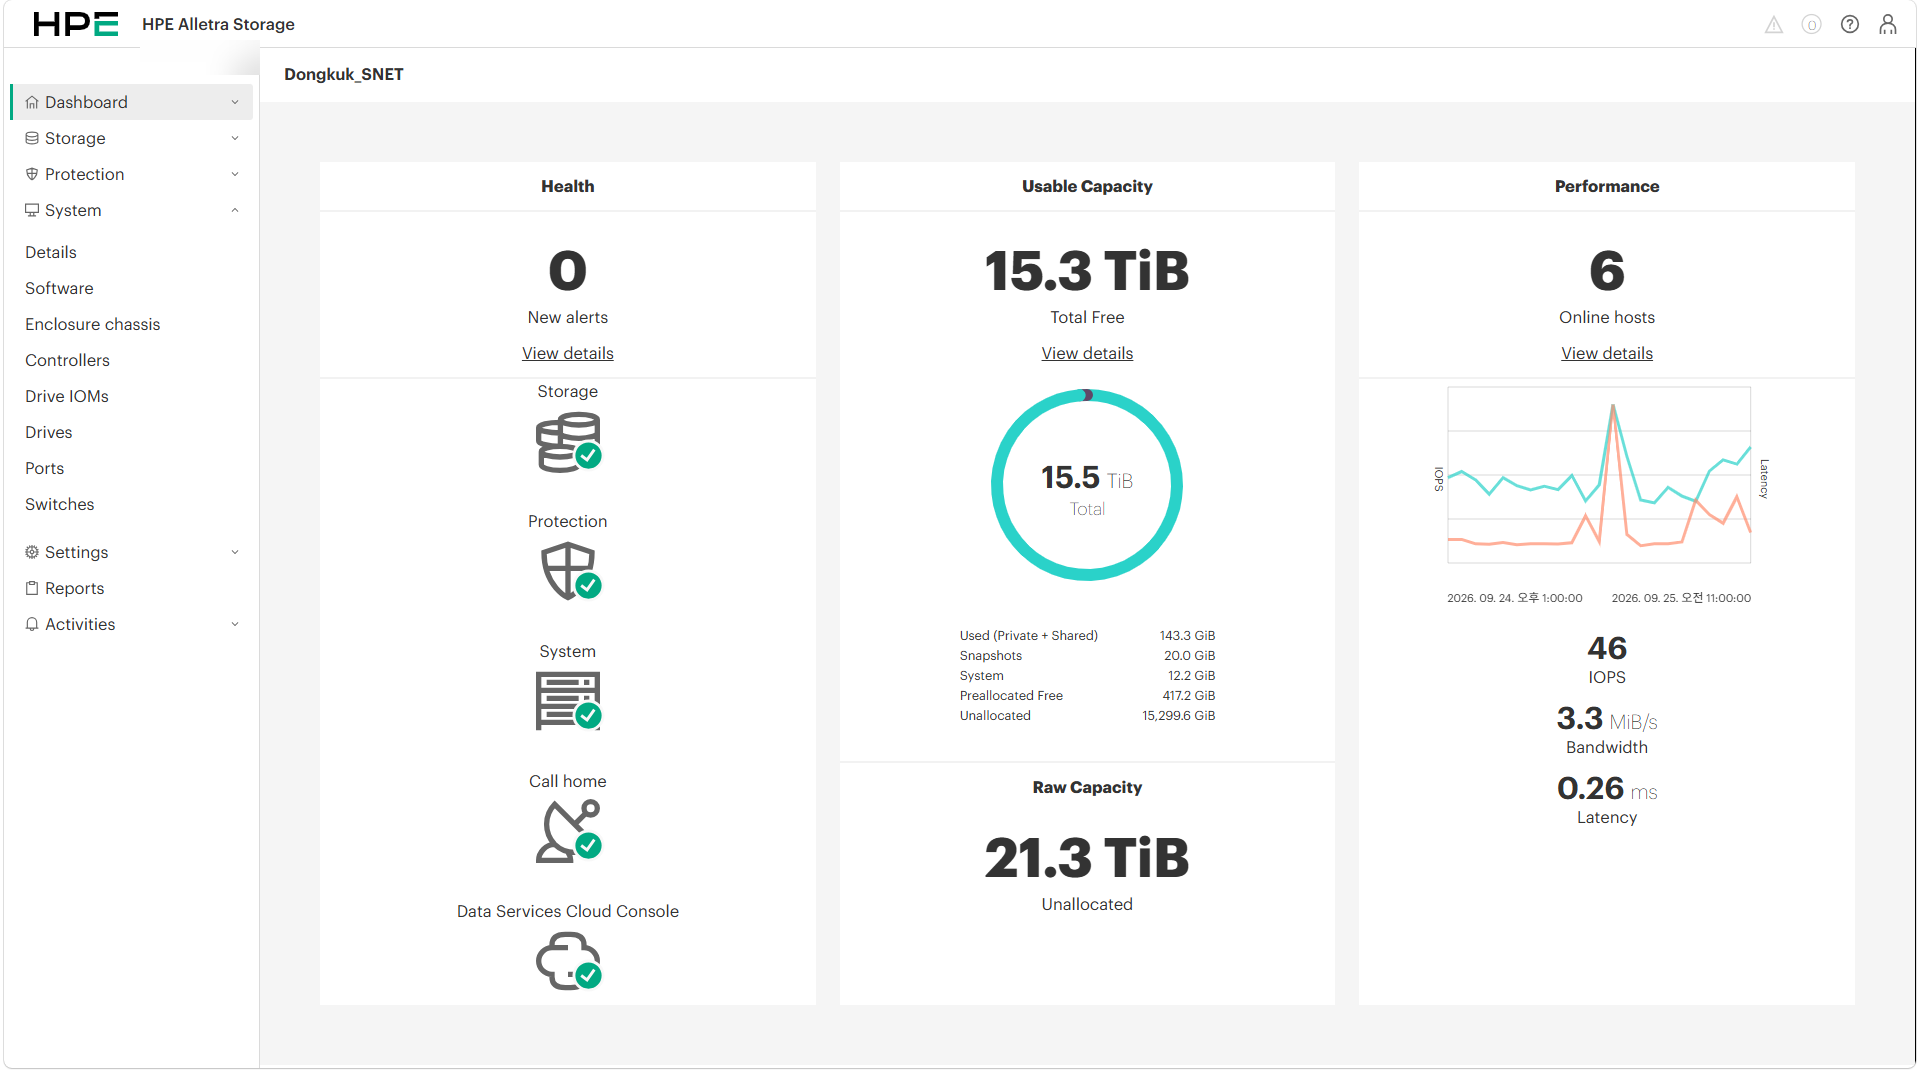
Figure 3. Main Dashboard - Real-time metrics for Health, Usable Capacity, and Performance
3.2. Storage (Block Volumes, Host Sets & VMware Integration)
The central operational workspace for provisioning and managing all block storage objects, host definitions, and migrations.
- BLOCK: Virtual volume sets, Volumes, Host sets, Hosts
- VMWARE: VMware storage containers integration
- PEER MOTION: Online non-disruptive migration orchestration from older 3PAR or Primera arrays
- Quick actions: One-click shortcuts to create host sets, provision volume sets, or launch tutorials
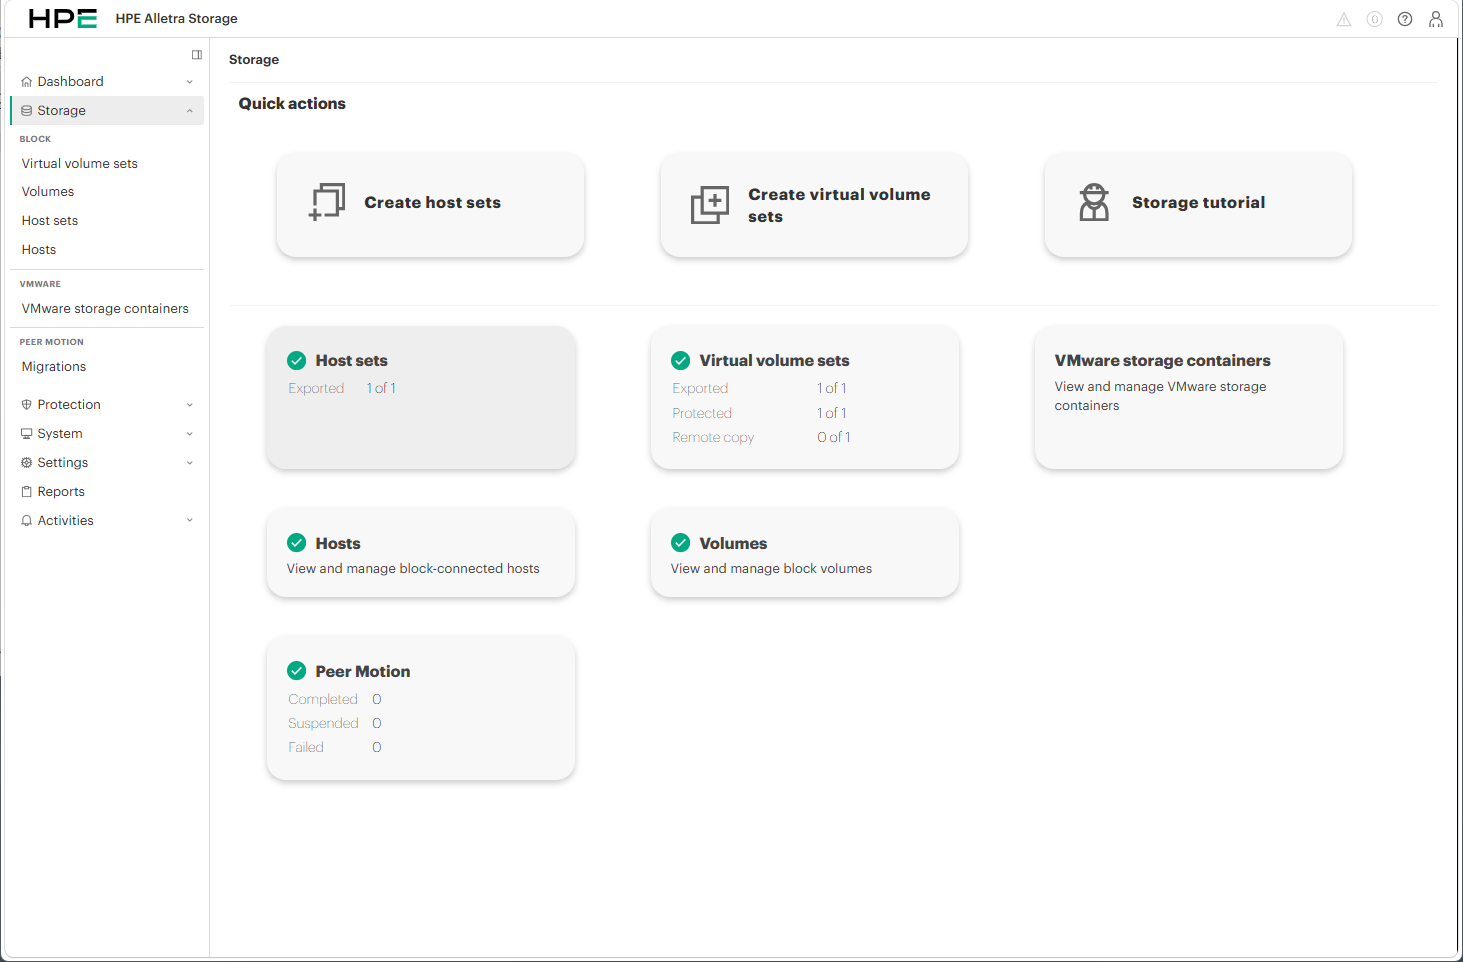
Figure 4. Storage Menu Overview - Block volumes, host groups, and Quick Action cards
Virtual Volume Sets & Volumes Management
Enables immediate inspection of provisioning ratios, capacity allocation, and protection policies across logical volume groups (e.g., VMware ESXi datastores).
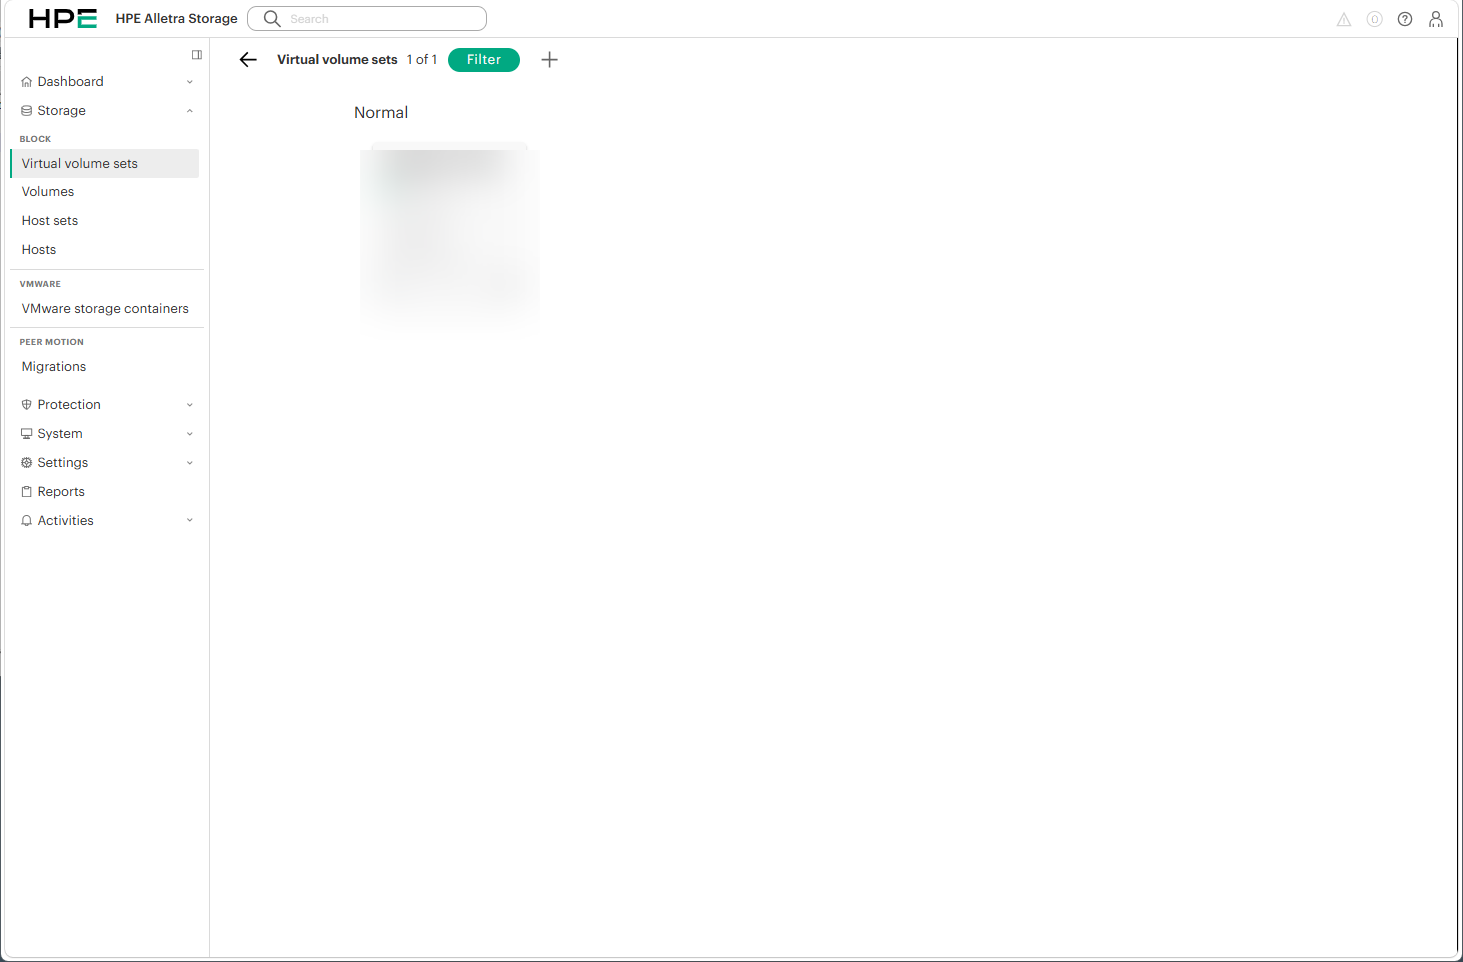
Figure 5. Virtual Volume Sets Detail - Volume group membership and export status
Host Sets & Connected Host Infrastructure
Provides structured visibility into clustered server groups (Host sets) and individual host nodes, ensuring all SAN paths report Normal status.
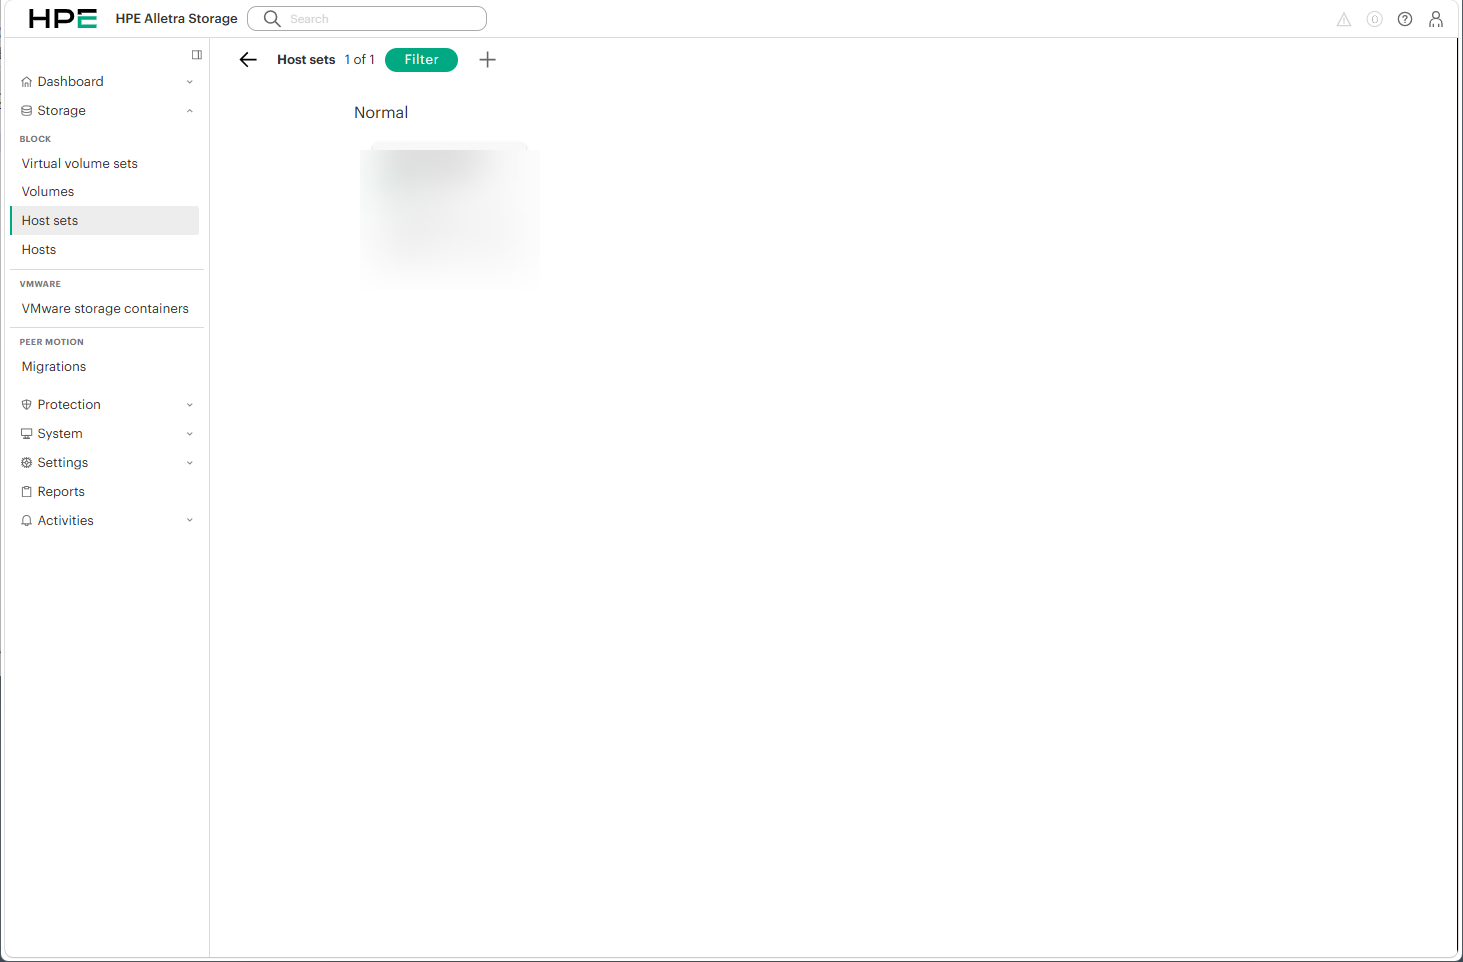
Figure 6. Host Sets View - Host server clustering and path health verification
3.3. Protection (Data Replication & Application Protection)
Consolidates remote replication sessions, HPE StoreOnce backup integrations, and application-aware protection policies into a card-based view.
- REPLICATION: Replication partners and remote target systems
- BACKUP SYSTEMS: Direct integration with HPE StoreOnce appliances
- APPLICATION PROTECTION: Policy management for VMware Datastores, VMs, VM protection groups, and Microsoft SQL Server databases
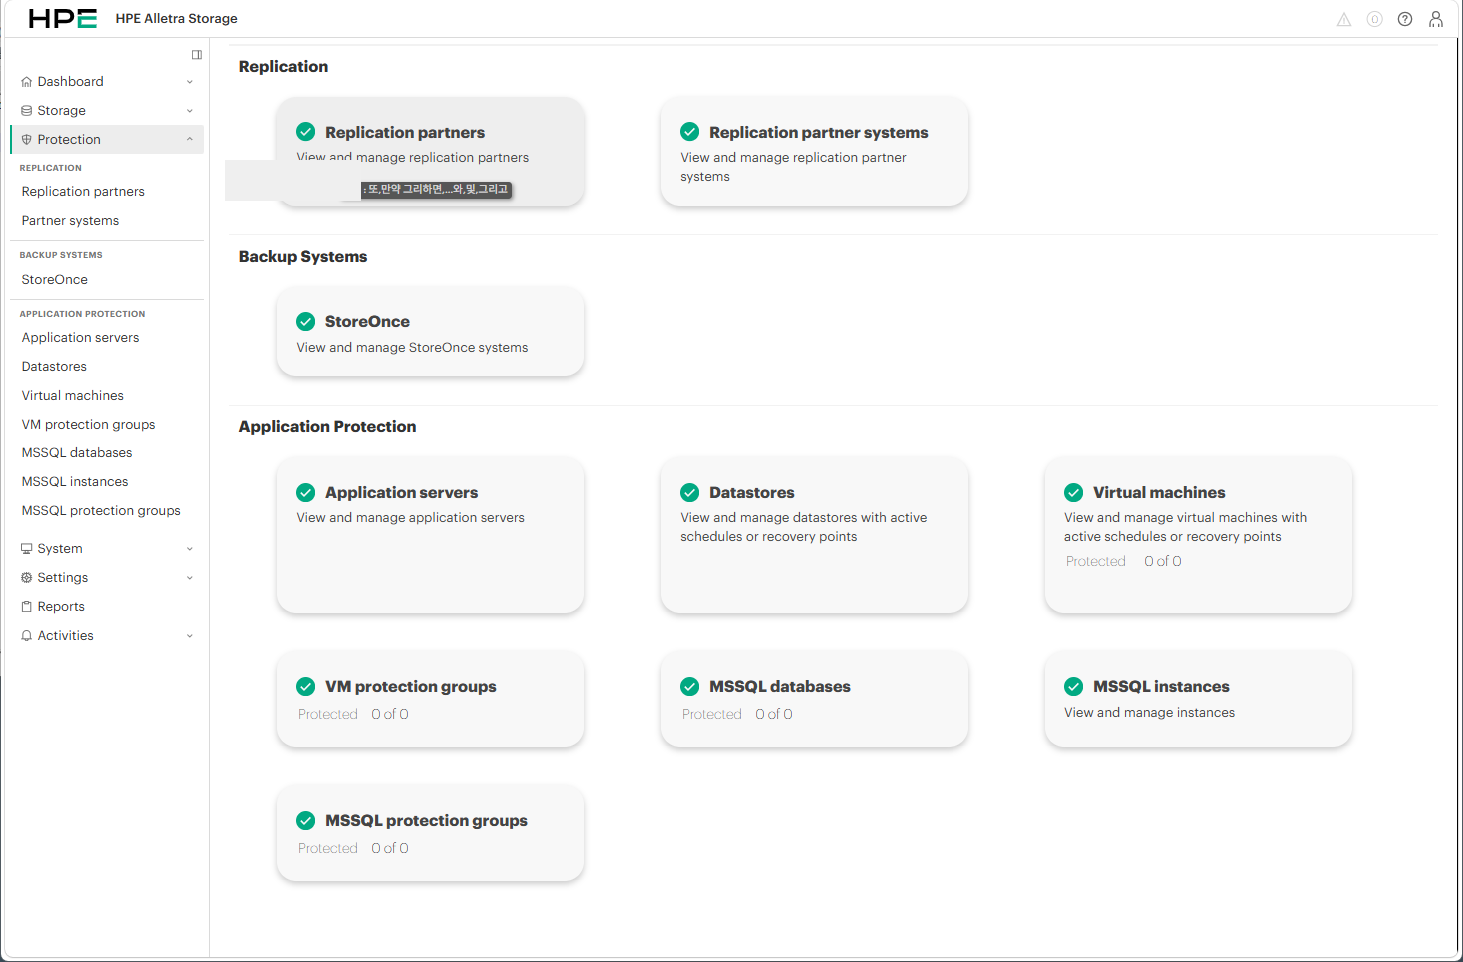
Figure 7. Protection Menu Overview - Remote replication, backup targets, and application protection
3.4. System (Hardware Chassis, Controllers & Physical Components)
Dedicated to physical infrastructure health, hardware diagnostics, and low-level component telemetry.
System Details
Presents hardware specifications (HPE Alletra Storage MP B10120), operational OS version (10.6.0), system uptime, hardware encryption capability, and hardware summary counts (2 Controllers, 1 Enclosure, 8 Drives, 8 FC Ports).
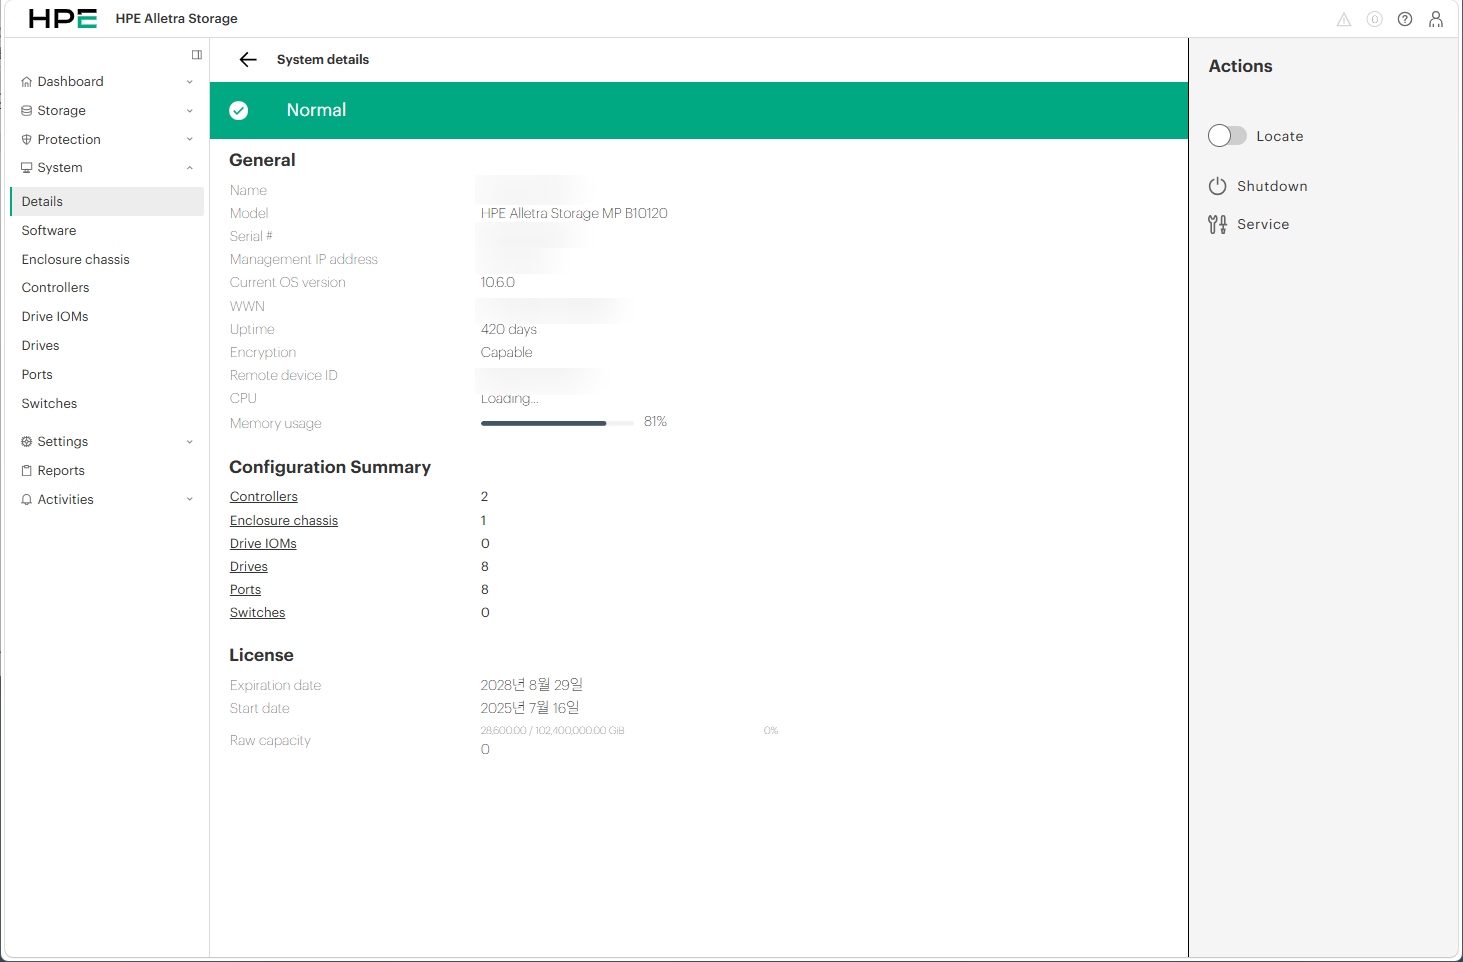
Figure 8. System Details View - Model specs, OS 10.6.0 operational status, and license summary
System Software (OS Firmware & Lifecycle Policies)
Displays running OS version (10.6.0) alongside configured cloud staging policies (Software Update Policy) managed directly from the local array or GreenLake.
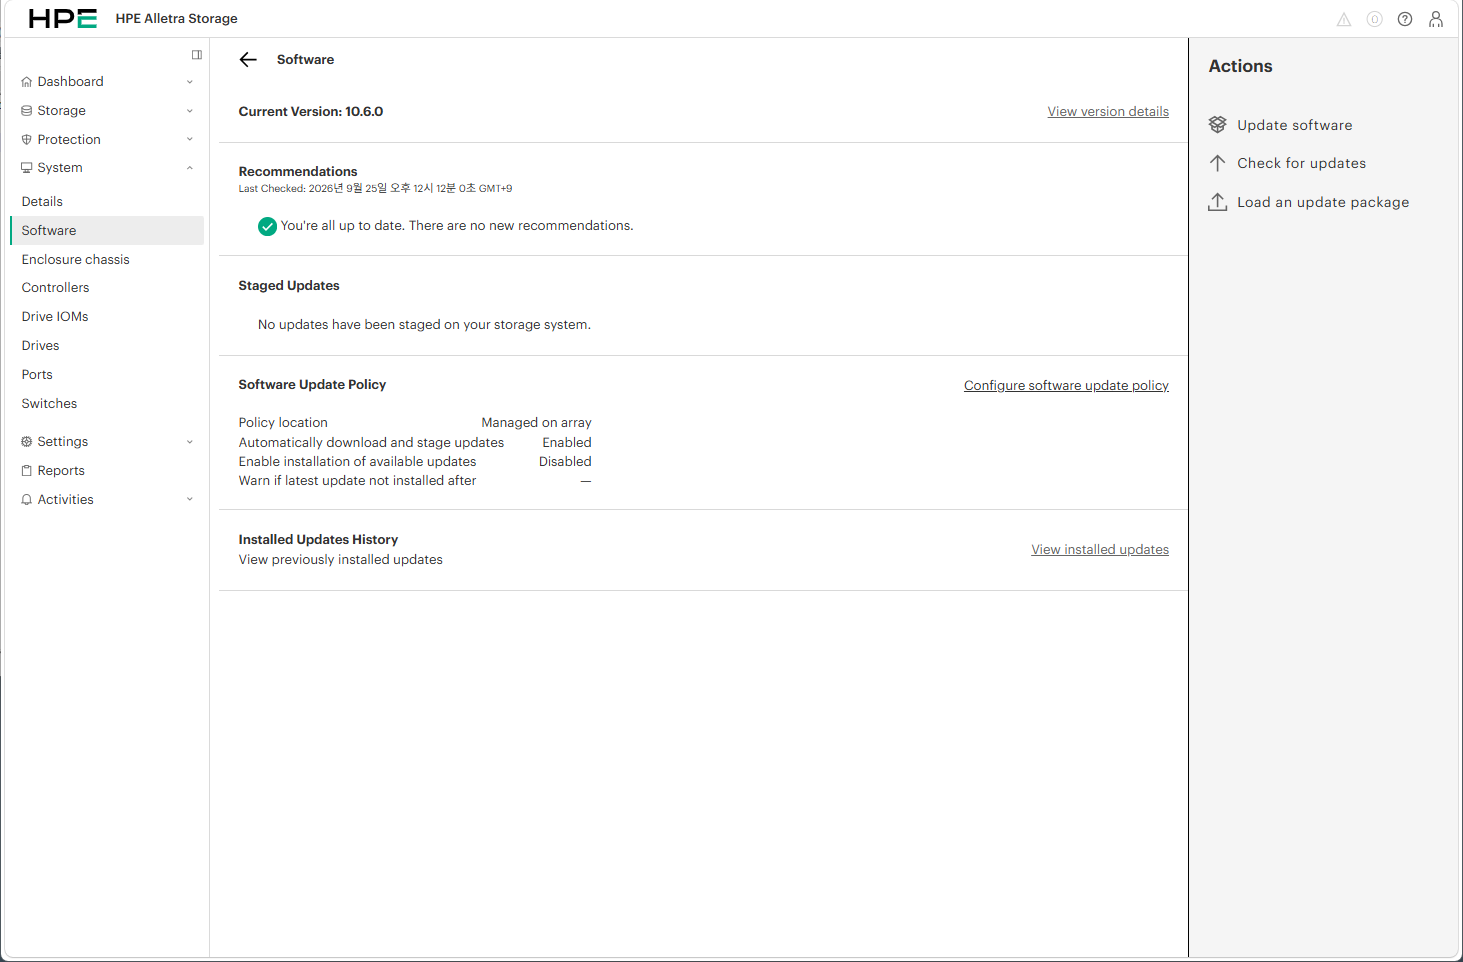
Figure 9. System Software View - Firmware version tracking and automatic staging policies
Enclosure Chassis & Controllers
Interactive graphical schematic representing enclosure bay locations, power supplies, Chassis Discovery Modules (CDM), and dual active-active controller nodes (Node 0 Master / Node 1).
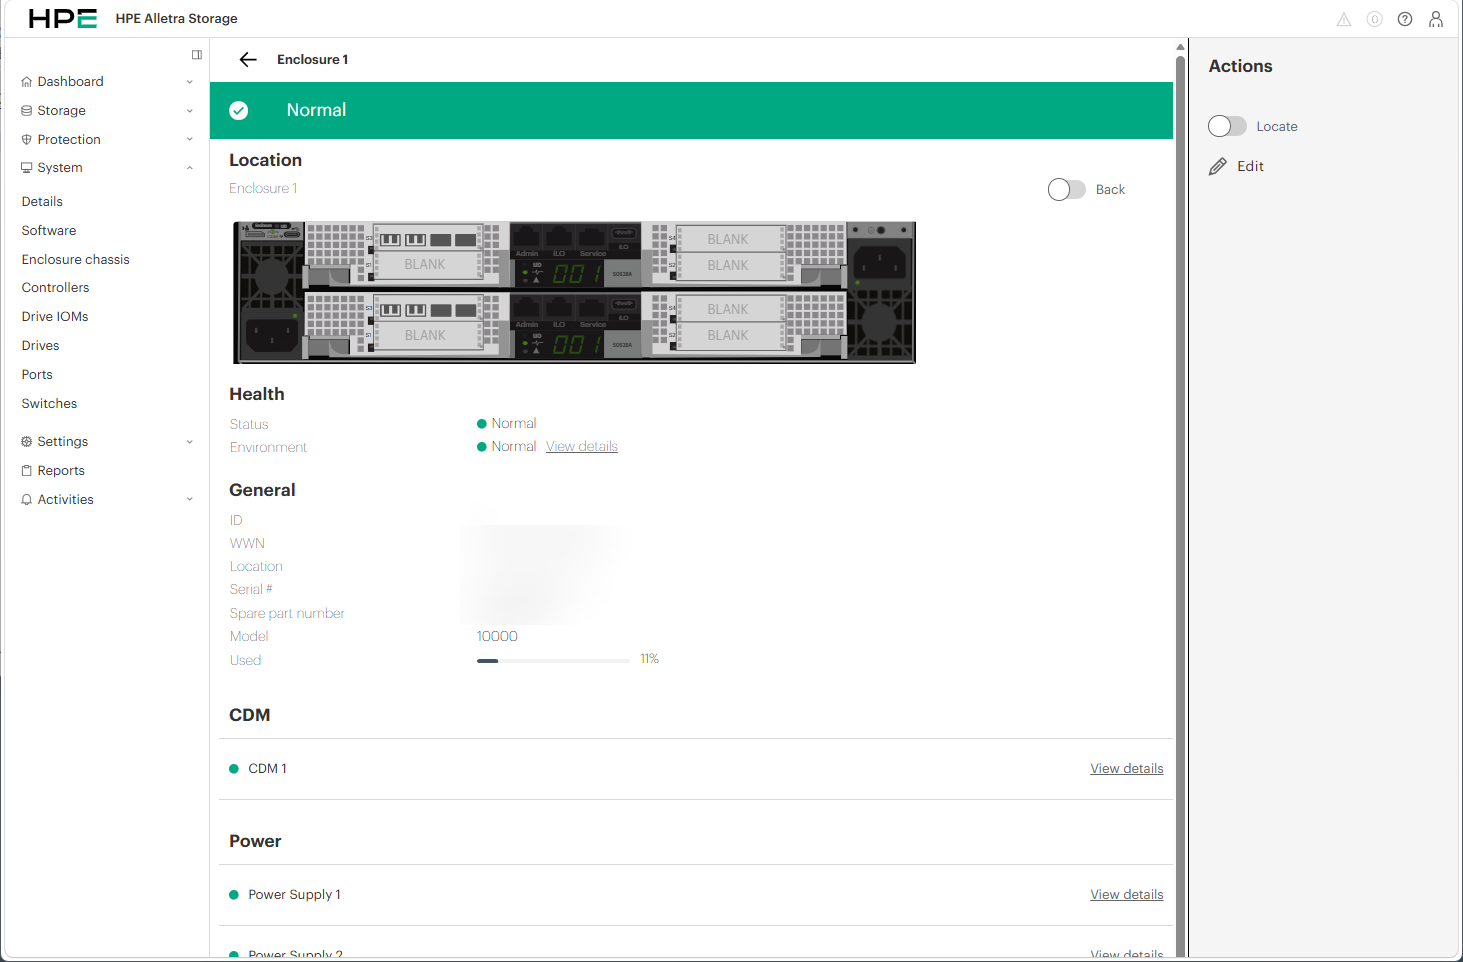
Figure 10. Enclosure Details - Rear chassis module layout and dual-controller operational status
Drives & Ports
Provides individual status cards for all 8 NVMe SSD drives (Slots 1:1 through 1:8, 3.84TB each) and 8 high-speed FC front-end host ports.
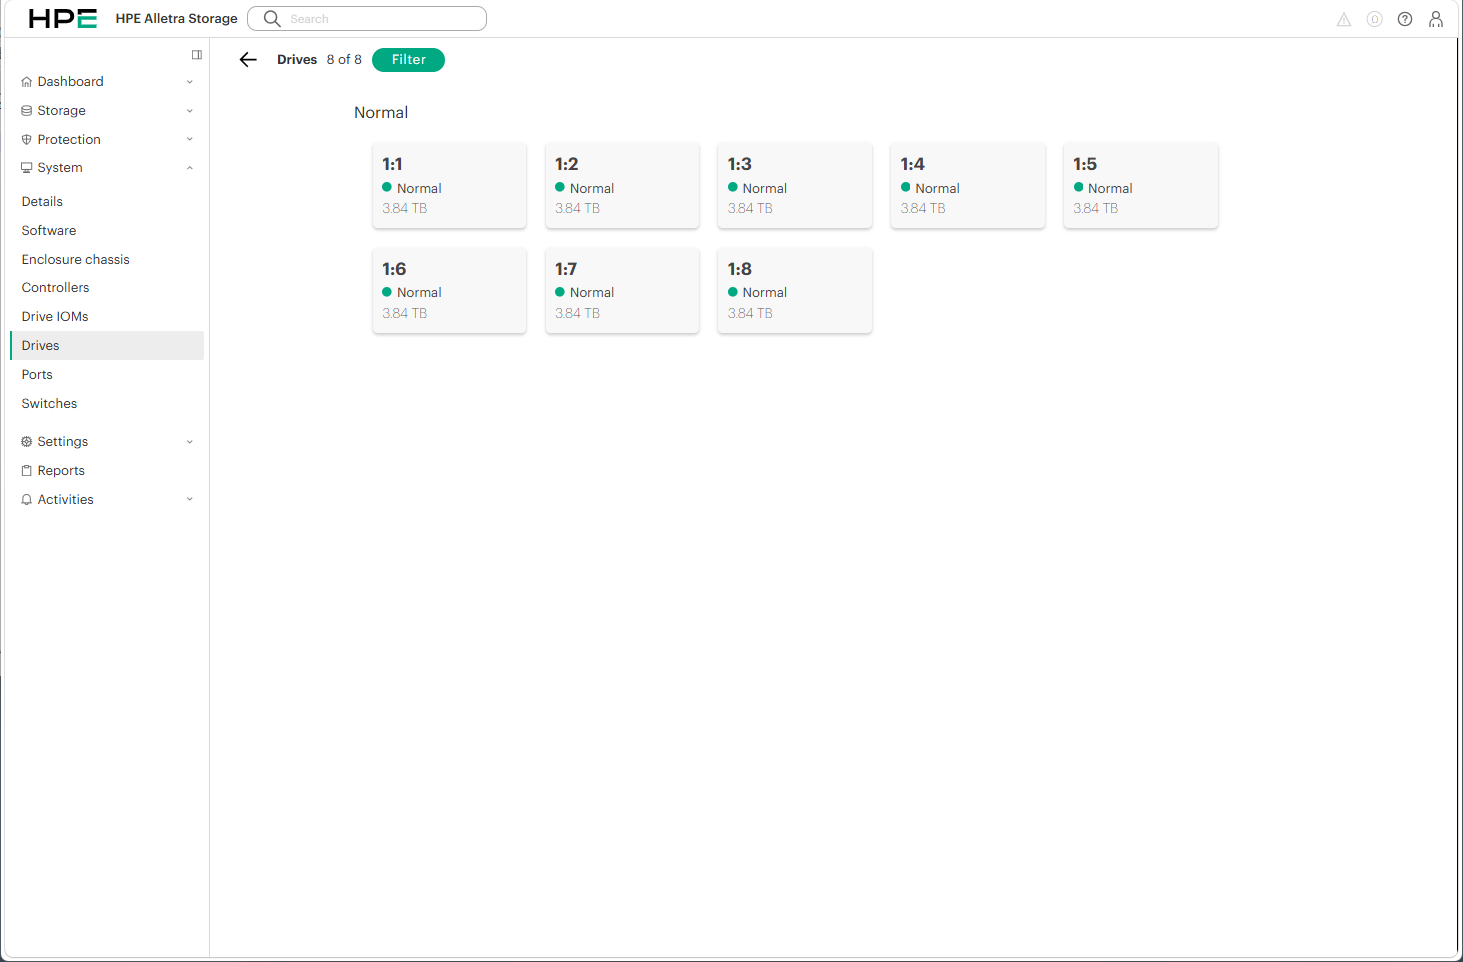
Figure 11. System Drives View - Health and capacity state of 8 all-NVMe SSD drives
3.5. Settings (Unified Configuration, Network & Security)
A central administration hub uniting system parameters, networking, identity, and certificates.
- Integrated Settings Categories: System, Telemetry, Users, Domains, LDAP configuration, Contacts, VMware vCenter, HPE VM Essentials, Network services, Array certificates, and Trusted certificates.
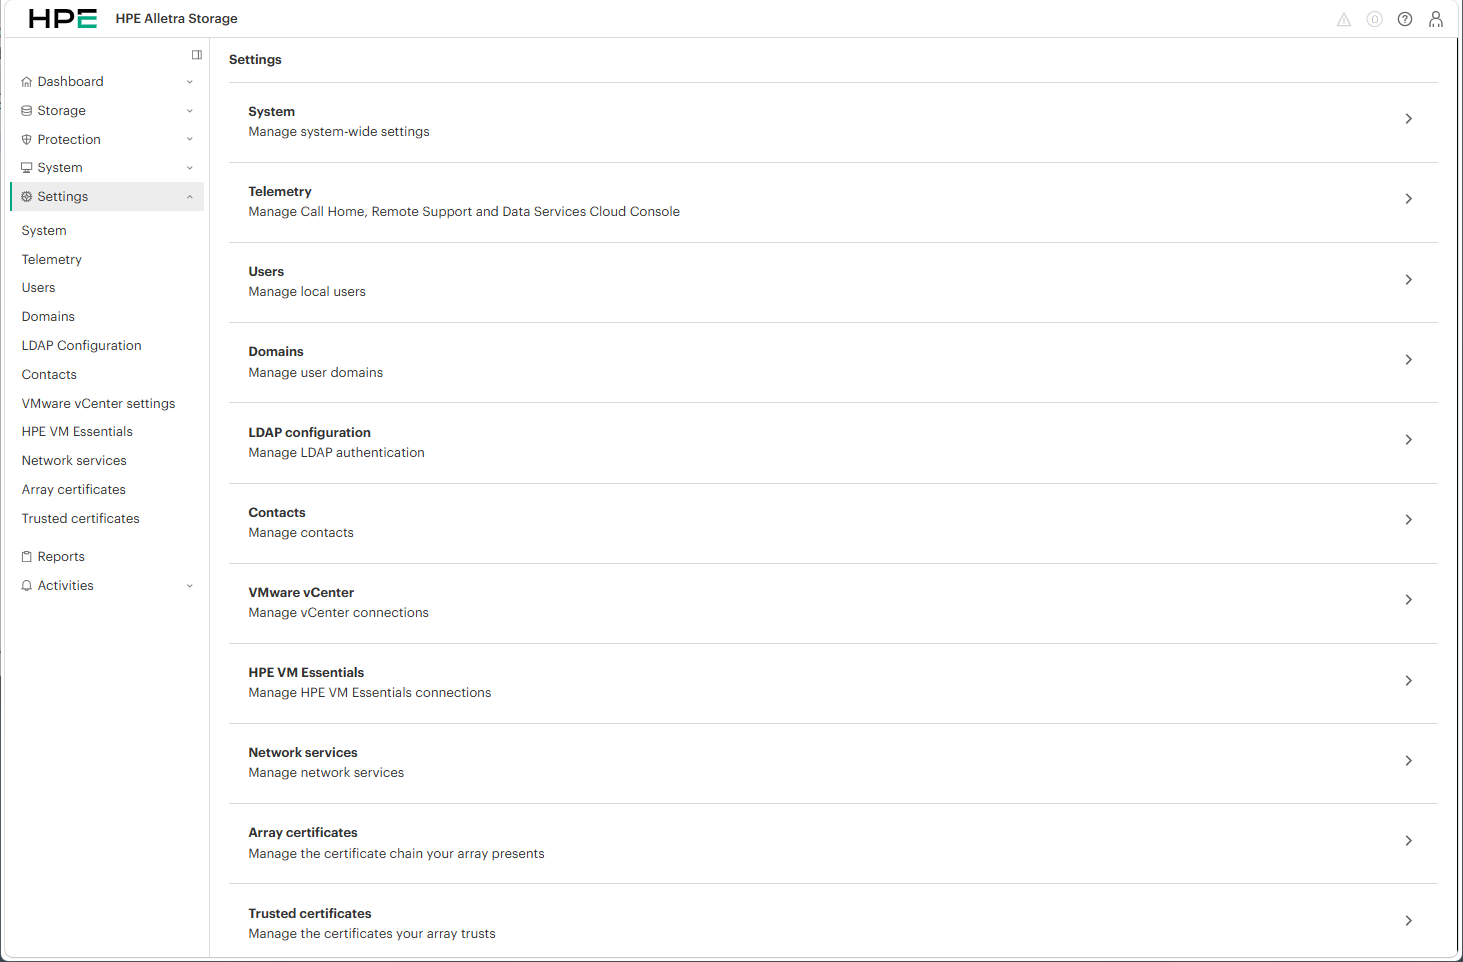
Figure 12. Settings Overview - Centralized management for networking, users, and security certificates
Settings ▶ System (Management Network & Data Security Policies)
Configures management IPv4 addresses, subnet masks, default gateways, and DNS servers, while centrally defining Volume Retention periods and Ransomware Detection sensitivity levels.
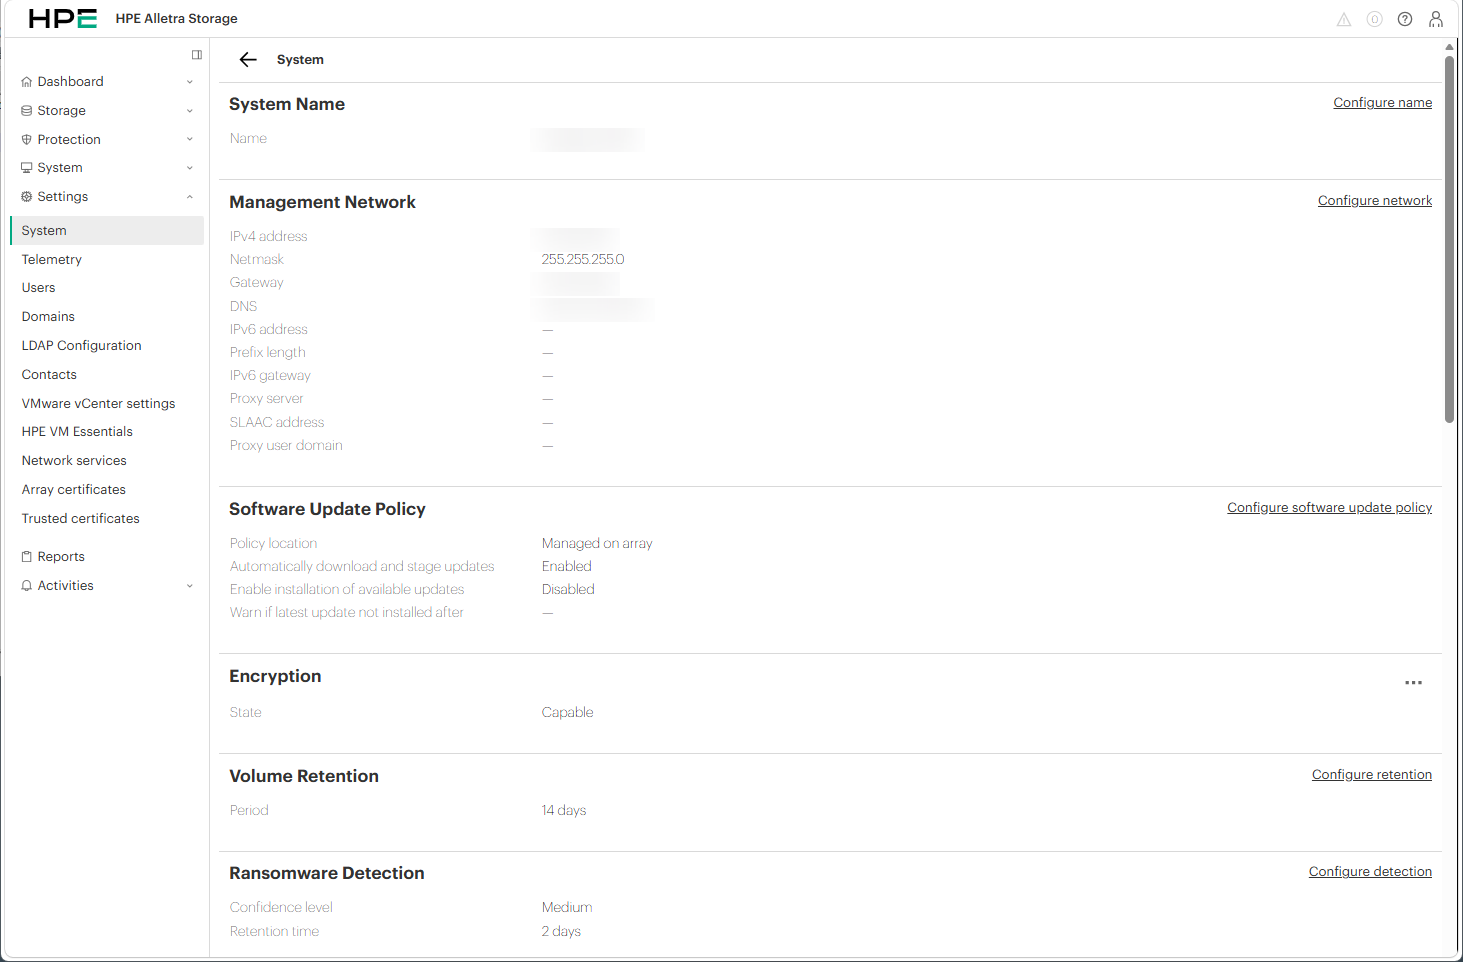
Figure 13. Settings-System View - Management network IP configuration and ransomware protection
Settings ▶ Telemetry (Call Home & Data Services Cloud Console)
Monitors outbound Call Home connectivity for proactive automated hardware dispatch, alongside active cloud binding status for HPE GreenLake Data Services Cloud Console (DSCC).
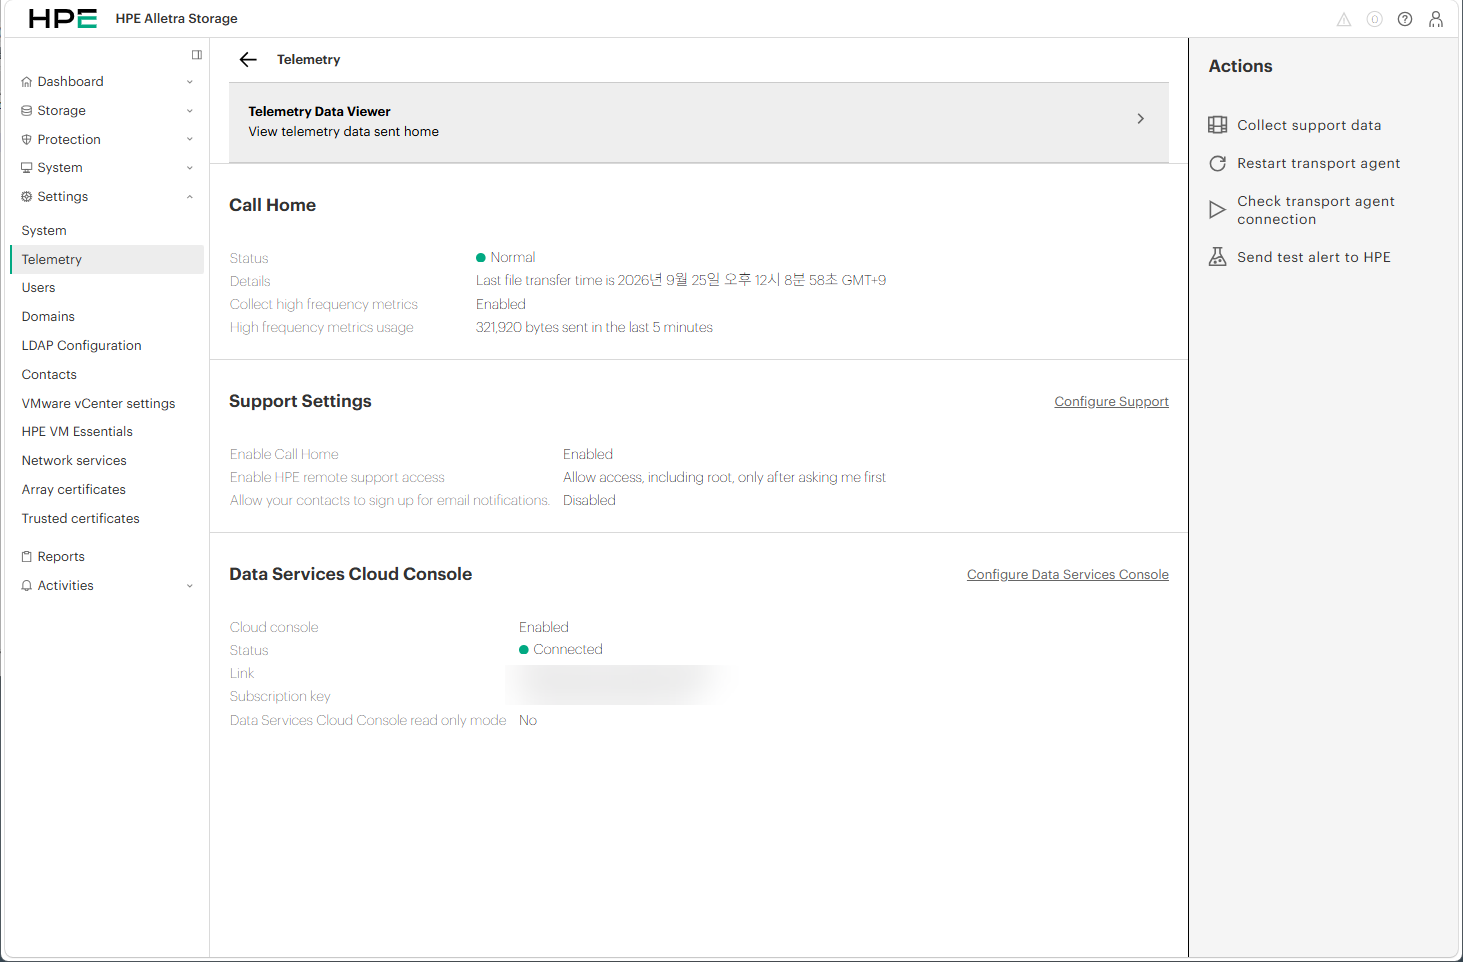
Figure 14. Settings-Telemetry View - Call Home and DSCC cloud telemetry status
Settings ▶ Contacts (Support Notification Directory)
Maintains registered customer administrator contact cards and technical support escalation directories.
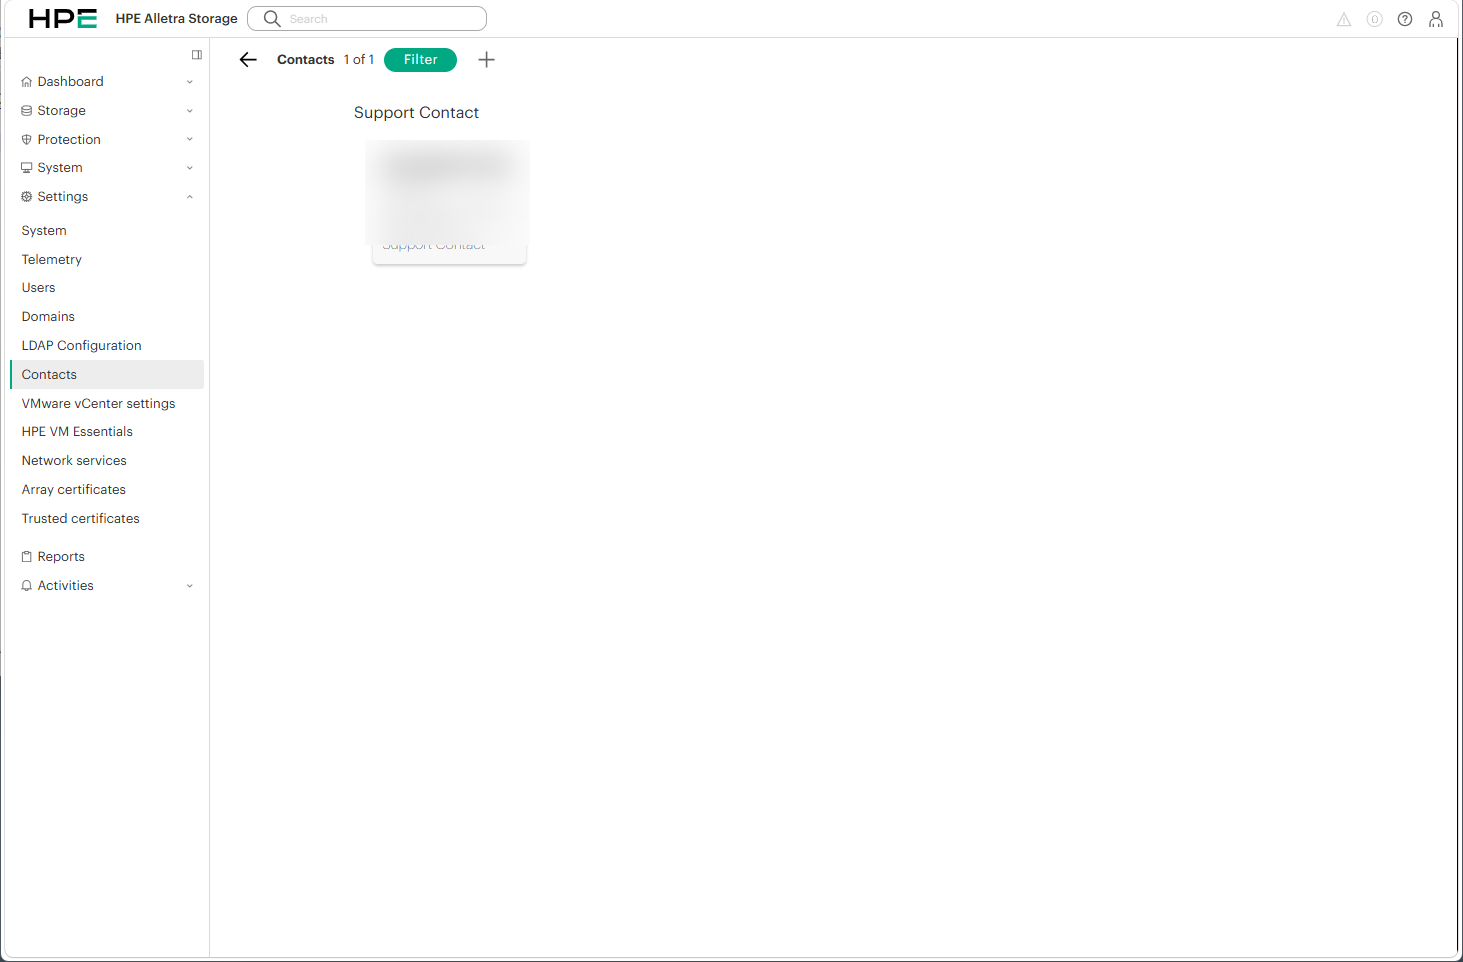
Figure 15. Settings-Contacts View - Administrator notification profile management
3.6. Reports & Activities (Reporting & Task Execution Auditing)
Reports (Real-Time Performance & Capacity Analytics)
Enables engineers to instantly generate custom performance reports (Create report) capturing CPU, memory, IOPS, and latency across custom time intervals.
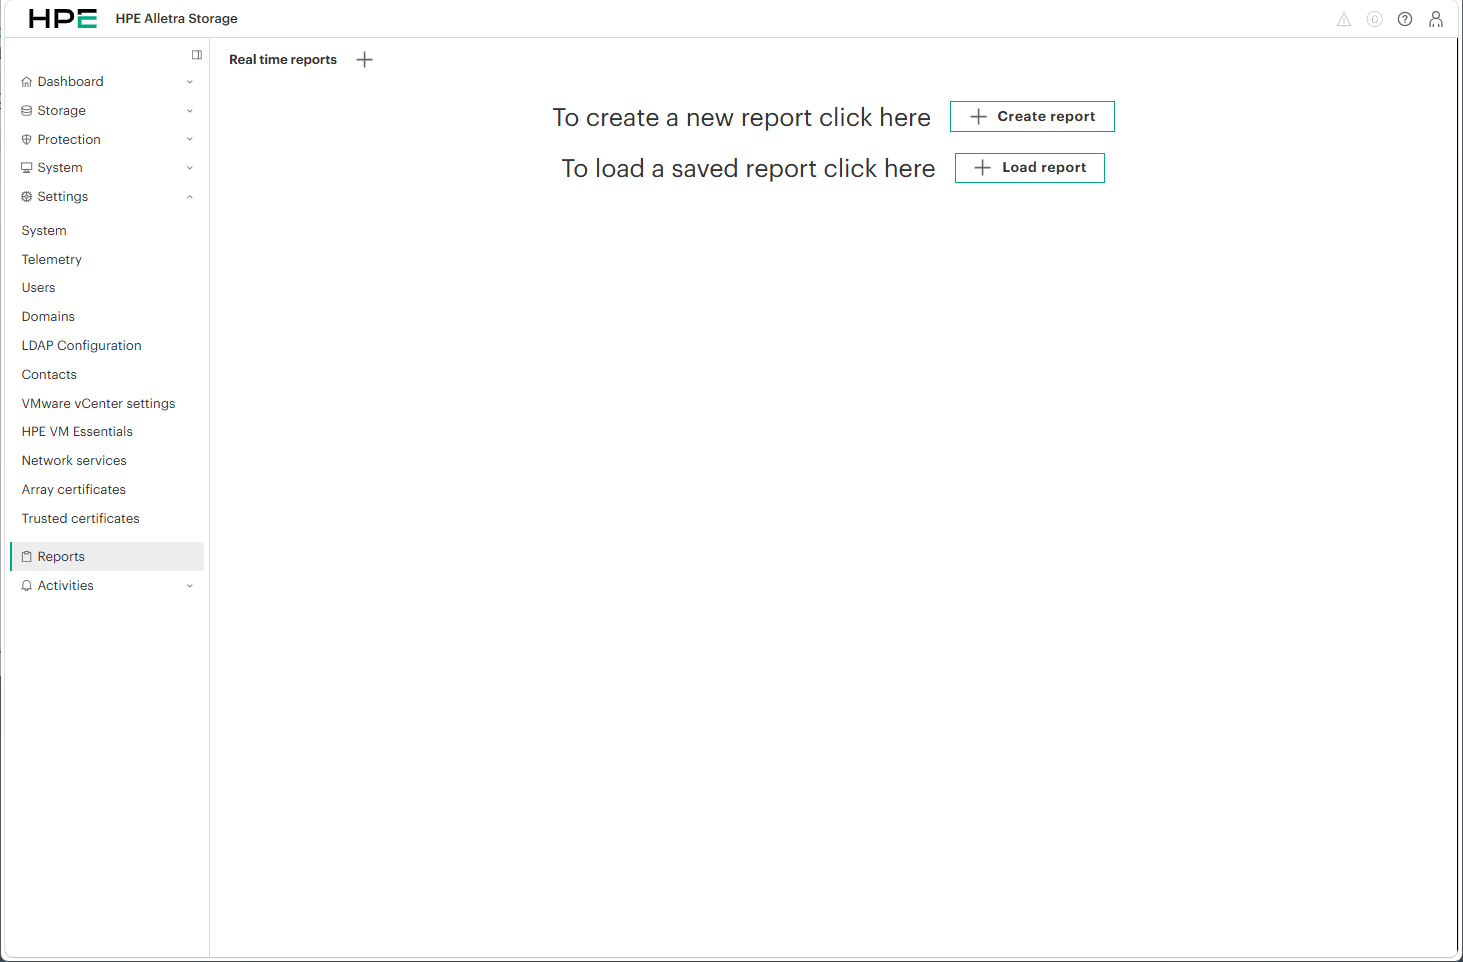
Figure 16. Reports View - Real-time custom metric reporting and template loading
Activities (Alerts, Tasks & Schedules)
Provides unified auditing across real-time hardware alerts (Alerts), active and historical background operations such as firmware upgrades or volume creations (Tasks), and scheduled jobs (Schedules).
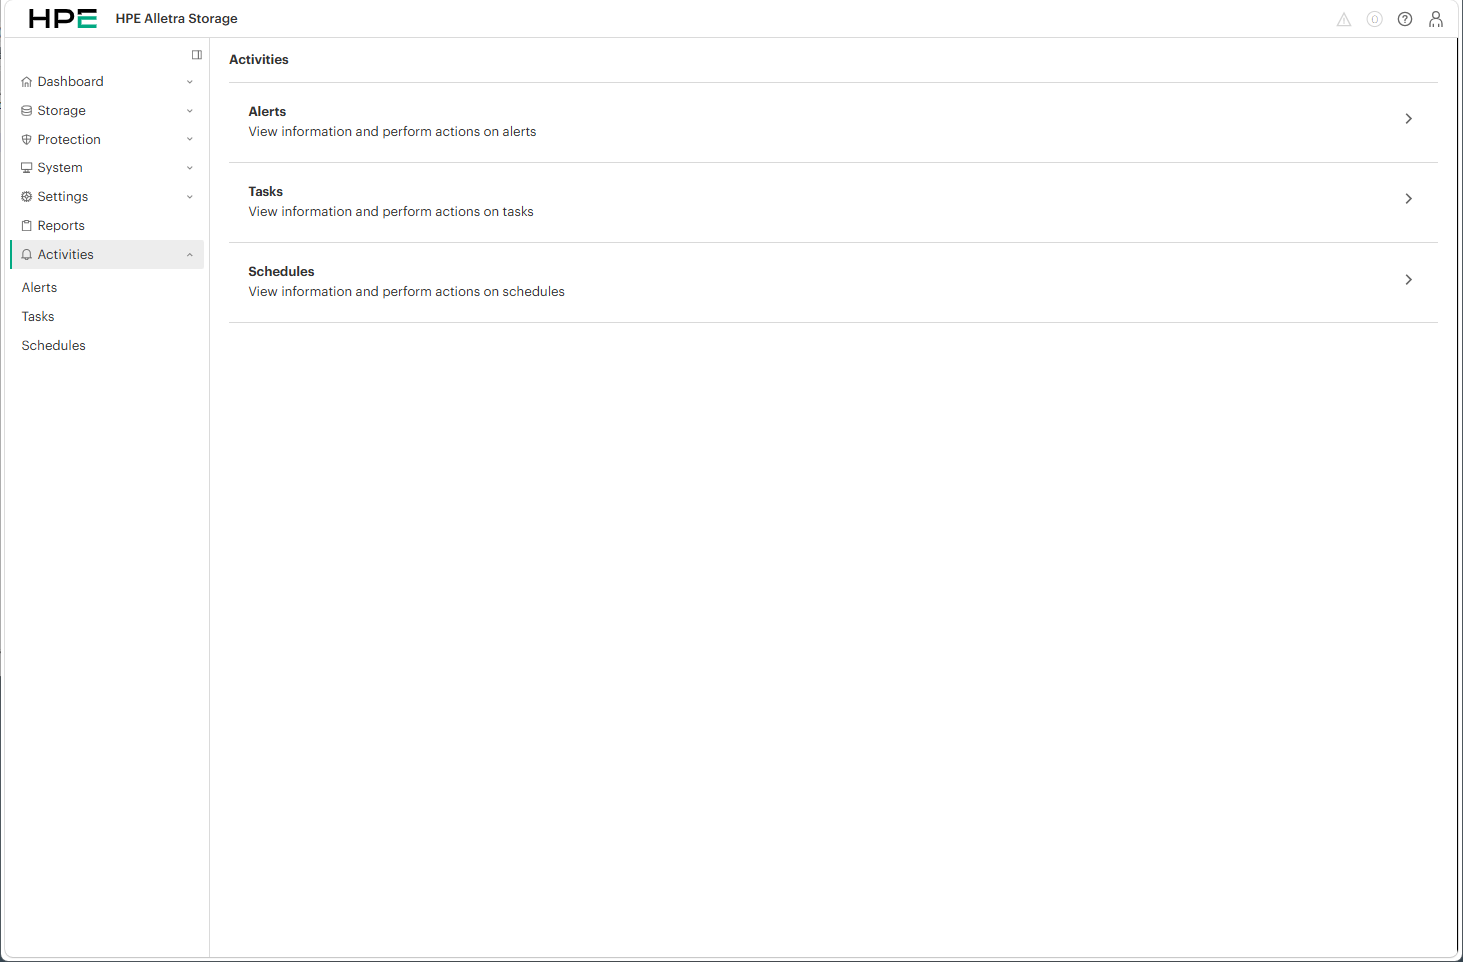
Figure 17. Activities View - Real-time system alerts, background task history, and maintenance schedules
4. Field Engineering Summary & Operational Impact
Streamlined Navigation Workflows:
The persistent multi-level text tree on the left reduces menu navigation overhead, allowing engineers to transition between volume troubleshooting and physical port diagnostics in a single click.Immediate Fabric Port & Switch Visibility:
SAN zoning and physical link verification no longer require digging through deep hardware sub-menus;PortsandSwitchesare readily accessible from the root navigation tree.Centralized Data Security Governance:
Unifying Volume Retention and Ransomware Detection withinSettings ➔ Systemensures enterprise compliance policies are verified with minimal friction.
5. Technical Support Guidance
The ArcusOS 10.6.0 web console represents a substantial visual and operational leap for HPE Alletra Storage MP B10K systems, delivering cloud-like responsiveness in an on-premises deployment.
⚠️ Field Engineering Support Advisory:
HPE Alletra Storage MP systems host tier-1 mission-critical business data. If you encounter complex SAN design requirements, unresolved pre-upgrade readiness warnings, or complex replication configurations, always engage certified HPE Pointnext Services or authorized partner engineers for verified deployment assistance.